
FX Report 2026 Week 38

Executive Summary
- Broad dollar strength. The U.S. dollar gained against all six major pairs captured. USD/JPY rose 1.60%, USD/CAD 1.15% and USD/CHF 1.13%, while EUR/USD fell 1.08%, GBP/USD 0.86% and AUD/USD 0.52%. The yen moved from the prior week’s standout performer (USD/JPY −1.31% in Week 37) to the weakest of the six against the dollar.
- Policy outcomes matched forecasts; U.S. data beat them. The economic calendar showed the Federal Reserve, Bank of England and Bank of Japan outcomes in line with forecasts, while U.S. retail sales, the Philadelphia Fed index and jobless claims all beat. SOFR futures pricing moved toward higher implied rates (about 11 basis points in 2027 contracts), with the largest one-day move on Wednesday, the Fed decision day, when SOFR, Treasury and FX options activity all peaked.
- Futures participation fell sharply while options activity held. FX futures notional averaged about $79 billion per day versus about $252 billion over the prior week’s four sessions, and futures open interest fell 19.6%; the CME reports do not state a cause. Options notional held near prior-week levels, with the mix shifting from call-led early in the week to put-led from Wednesday, mainly in euro options.
- A concentrated JPY burst on Friday. JPY futures notional reached about $38 billion (41% of the day’s total, roughly 2.9 times Thursday) and JPY options were call-weighted, in the first session after the BoJ decision. Call-side activity alongside a weaker spot yen is a divergence, not a directional signal.
1. Foreign Exchange & Options
Spot performance
The dollar advance was broad rather than concentrated. USD/JPY’s 1.60% gain was the largest move; EUR/USD and GBP/USD declined in parallel, and AUD/USD was the most resilient, remaining up 6.63% year-to-date. Positive values in USD-first pairs indicate a stronger dollar.
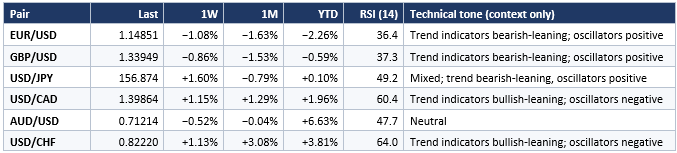
RSI sat in the mid-to-upper 30s for EUR/USD and GBP/USD and above 60 for USD/CAD and USD/CHF, below the conventional 70 overbought threshold. USD/JPY’s gain came within a negative one- and three-month profile (−0.79% and −2.78%), so the week reads as a rebound within a broader yen-strength trend rather than a confirmed reversal.
Futures and open interest
CME data show a sharp drop in futures participation from the prior week: notional traded averaged about $79 billion per day versus about $252 billion across the four sessions of September 8–11 (about 69% lower). Futures open interest fell from $333.7 billion on September 11 to $268.2 billion on September 18 (−19.6%), including a 19% drop on Wednesday. The CME reports do not state a cause; one possible contextual factor is the September quarterly contract cycle (WFG interpretation, not a documented cause). Euro FX led futures notional Monday through Thursday; the yen led on Friday ($38.0 billion versus $24.9 billion). Options behaved differently: notional averaged $5.6 billion per day, essentially unchanged from the prior four sessions (−0.6%), and open interest rose 6.8% to $91.6 billion. Euro options were 72% of the week’s options notional.
Options composition
Across all currencies, puts accounted for 52% of weekly options notional ($14.6 billion versus $13.4 billion for calls), but the balance changed during the week: calls led Monday (54%) and Tuesday (57%), while puts led Wednesday (56%), Thursday (60%) and Friday (52%). Put activity exceeding call activity is not, by itself, a bearish signal; it can reflect hedging, speculation or multi-leg structures.
- EUR: Calls and puts were nearly balanced for the week ($10.15 billion versus $10.11 billion), but single expiries drove the daily mix. Monday’s call lean was largely one June 2027 expiry ($1.63 billion of calls); Thursday’s put lean centered on the October 9 expiry ($1.49 billion of puts versus $0.29 billion of calls). Put-weighted open interest was stable at about 61–62%. Friday’s most active strike was 11.50 (which appears to correspond to 1.1500, near the 1.1485 spot close): 3,075 put lots versus 1,999 call lots for the September 25 expiry, consistent with near-the-money hedging or structured activity rather than a directional view.
- GBP, CAD, AUD: Puts were 63%, 65% and 59% of weekly options notional, respectively, alongside weaker spot for each against the dollar. GBP was the clearest case: put open interest rose from $184 million to $322 million while call open interest fell from $118 million to $81 million (put share about 61% to about 80%), consistent with increased demand for downside protection.
- CHF: The opposite pattern. Calls were 75% of weekly options notional, and $264 million of Friday’s $272 million was calls (September 25 and October 9 expiries), even as USD/CHF rose 1.13%.
- JPY: Friday stood apart: futures notional of about $38.0 billion (versus $13.0 billion Thursday) and options notional of $1.30 billion (versus $0.51 billion), with calls of $826 million against puts of $473 million, concentrated in October 9, September 25 and September 21 expiries. USD/JPY rose 0.58% that day. The mix cannot show whether participants were hedging, speculating or using multi-leg structures.
2. Rates & Macro
Economic backdrop
The week’s calendar centered on Wednesday’s Federal Reserve decision. The calendar listed the Federal Funds Rate at 4.00% (forecast 4.00%; previous 3.75%), so the outcome matched the forecast. The FOMC statement, projections and press conference were not among the materials reviewed, so this report does not characterize the decision or Fed communication. U.S. data beat expectations: retail sales rose 1.2% m/m (forecast 0.8%), core retail sales 1.4% (forecast 0.6%), the Philadelphia Fed manufacturing index was 37.8 (forecast 31.3, previous 47.4), and initial jobless claims were 196,000 (forecast 207,000).
Abroad, the Bank of England held at 3.75% as forecast, U.K. CPI was 3.1% y/y (in line; previous 2.9%) and U.K. retail sales rose 0.5% versus a forecast decline of 0.2%. The BoJ policy rate was listed as <1.25% (forecast <1.25%; previous <1.00%), matching the forecast. The calendar carried no scheduled euro-area data releases, only ECB President Lagarde speeches on Monday and Friday, so the euro’s decline occurred without a scheduled euro-area data catalyst.
SOFR and Treasury markets
SOFR futures-and-options volume peaked Wednesday at 9.8 million contracts, about 1.5 times the week’s five-day average (6.4 million) and about 2.3 times the prior month’s average (4.3 million); options volume that day (2.56 million) was roughly double Monday’s and Tuesday’s. All eight of Wednesday’s most active SR3 option strikes were puts, while Thursday’s mix rotated toward calls; the mix does not by itself establish a policy view. Futures open interest fell 7.9%, concentrated in the 2026-06 contract month (1.34 million contracts Monday, none by Friday), consistent with that contract rolling off; options open interest rose 7.3%.
Settlement prices provide the pricing evidence: SR3 futures fell across the curve, equivalent to implied rates rising about 3.5 basis points in the September 2026 contract and about 11–11.5 basis points in March, June and September 2027 contracts (WFG calculation from CME’s daily settlement changes). The largest daily move came Wednesday (about 9–10 basis points in March and June 2027), with a partial retracement in 2027 contracts Thursday and further declines Friday.
Treasury futures volume averaged 7.1 million contracts per day (8% below the prior four sessions) and peaked Wednesday at 8.7 million; futures open interest rose every session, ending 1.8% higher at 23.5 million. Treasury options open interest rose 21% to 8.6 million, concentrated in 10-year note options (October call open interest up 33% from Monday; November put open interest up 49%). Calls were 57% of weekly Treasury options volume versus about 46% in the prior four sessions. The Treasury reports measure participation rather than price, so WFG draws no conclusion on Treasury yield direction.
3. Cross-Market Observations
- Fed-day activity cluster. Wednesday saw the week’s peak in SOFR, Treasury and FX options activity, the largest daily SOFR repricing, and a higher put share in FX, SOFR and Treasury options versus Tuesday (the put lean persisted into Thursday only in FX options). This coincided with the Fed decision and strong U.S. retail sales; the data do not establish that either drove the activity or repricing.
- Large spot moves, subdued futures participation. Four pairs moved more than 1% while futures notional ran about two-thirds below the prior week’s pace, so the dollar’s advance was not accompanied by elevated futures volume (Friday’s JPY surge aside). The spot data cover weekly and Friday moves only, so daily timing cannot be established.
- Options mix and spot agreed in some currencies and diverged in others. Put-leaning options in GBP, CAD and AUD coincided with dollar strength against each, while call-side activity dominated in JPY and CHF even as both weakened. Options activity is not a forecast; the divergence shows that hedging and positioning demand did not uniformly follow spot direction.
4. WFG Market & Corporate Risk Monitor
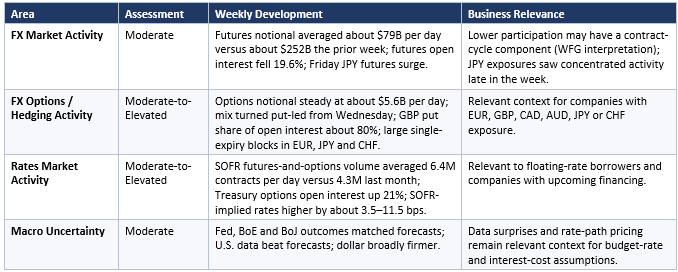
The assessments below are qualitative observations based on this week’s available market data. They are not quantitative risk scores, trading signals, or hedge recommendations.
5. What This Means for Businesses
What changed: the dollar strengthened against every major pair captured, SOFR-implied rates moved higher, and options activity shifted toward puts in several currencies while diverging from spot in the yen and franc. The points below are prompts for review, not hedge-execution recommendations.
- Importers and exporters. The dollar’s gains lowered the USD cost of foreign-currency payables and the USD value of foreign-currency receivables and overseas revenue, relative to a week earlier. Companies with budget rates set at earlier levels, particularly in EUR (−2.26% YTD), JPY, CAD and CHF, may want to revisit budget-rate sensitivity and translation effects.
- Hedge programs. Put-leaning options activity in EUR (from midweek), GBP, CAD and AUD, with activity concentrated around late-September and early-October expirations, supports reviewing hedge coverage and horizons for material exposures in those currencies. The JPY and CHF divergence from spot supports monitoring rather than inference.
- Floating-rate exposure. With SOFR-implied rates higher across the curve and the calendar listing the Federal Funds Rate at 4.00%, companies with floating-rate debt or upcoming financing may want to reassess interest-cost sensitivity and refinancing timelines.
- Conditions to monitor. Whether USD/JPY momentum and JPY derivatives activity persist after the BoJ decision; activity around the September 25 and October 9 expiries; further movement in SOFR-implied rates; and whether the put-leaning mix in EUR and GBP options persists or reverts. These are items for monitoring, not predictions.
As always, hedge ratios, hedge horizons, and forward or options coverage should be reviewed in the context of each company’s specific currency and rate exposures, payment timing, and risk tolerance, in consultation with WFG or another qualified advisor.